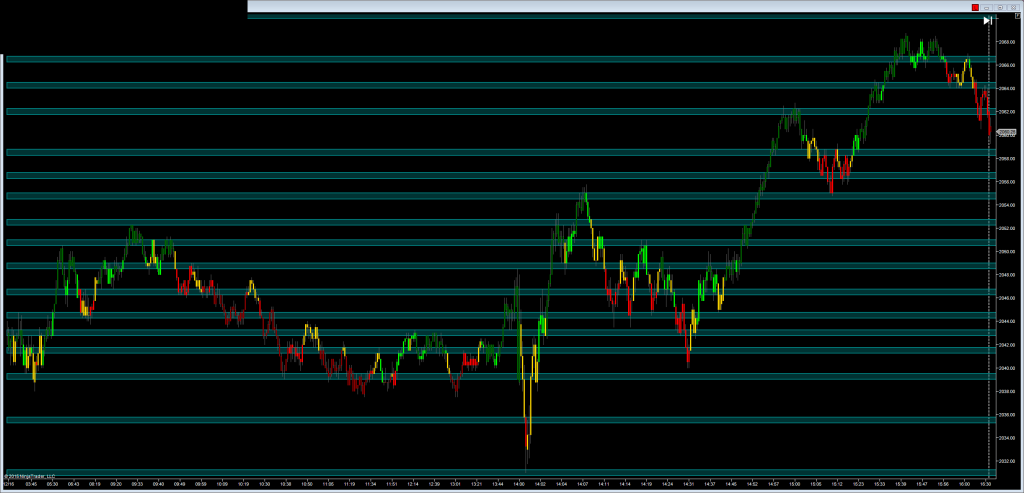
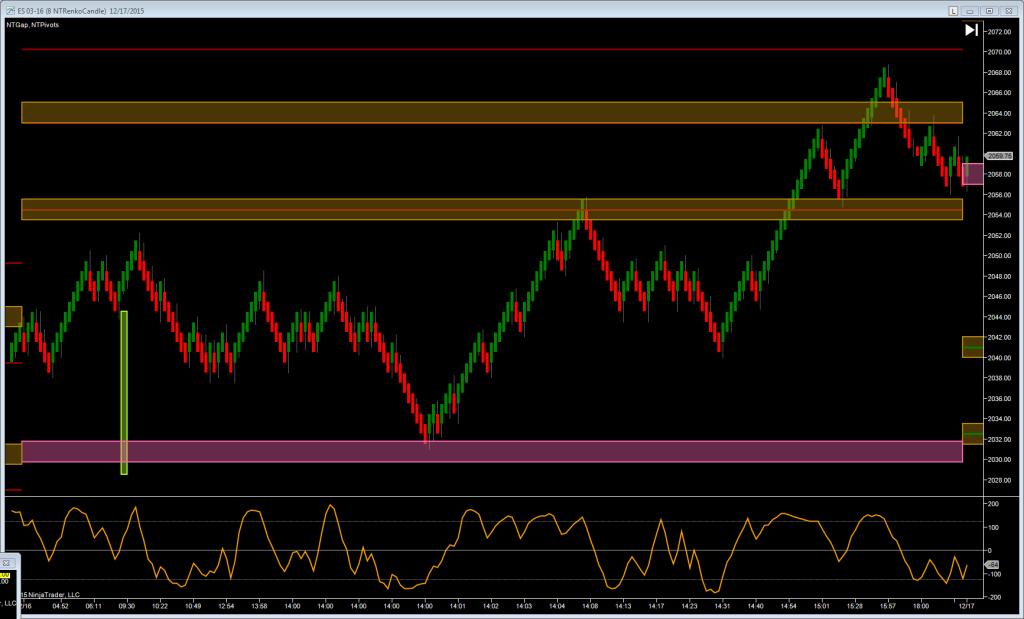
Understanding the areas where the Bulls and Bears will engage is paramount to successful trading. The first chart show our minor pivots used for scalp trades. The second chart shows intermediate pivots used for intra-day swing trades… Also on the second chart you will see a yellowish-green box… This is our daily high probability gap zone. When the market opens in this zone we have a 94.3% chance of filling the 1/2 gap and an 89.7% chance of filling the whole gap. Also take notice of the pink band… this is the bull/bear fight line with sell lines (red) above and buy lines (green) below (where you can get a quick scalp trade on the 1st touch). All of our active members get these important levels automatically on their NinjaTrader charts each day. CLICK HERE FOR A TRIAL to have these important levels on your S&P Emini Futures charts. The following charts were for FOMC Day December 16, 2015.

