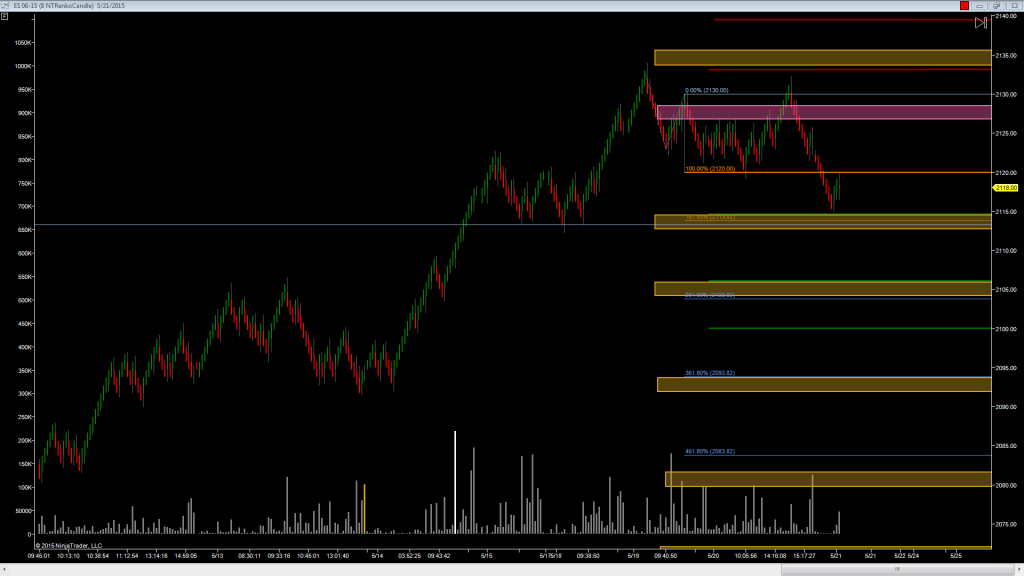
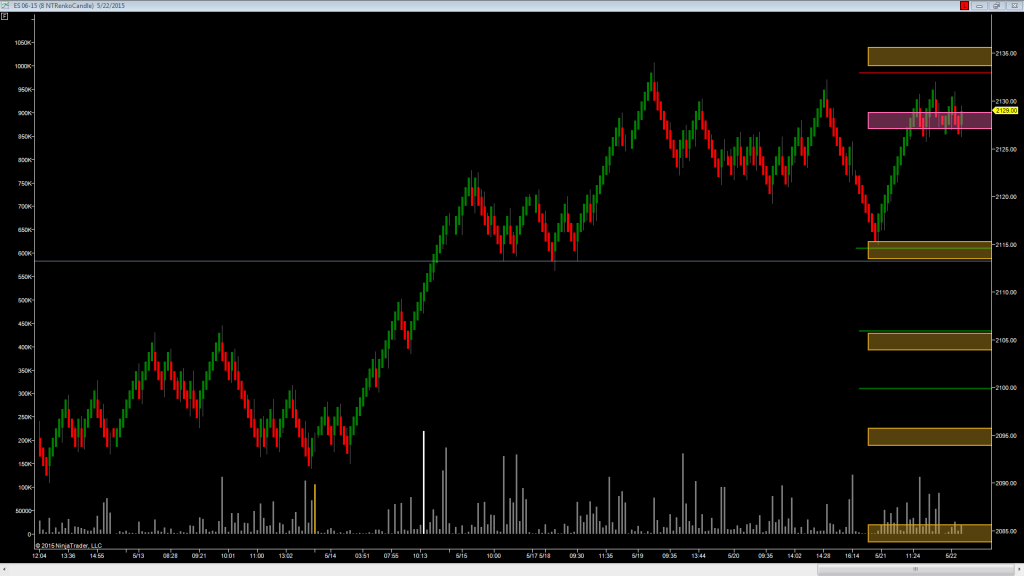
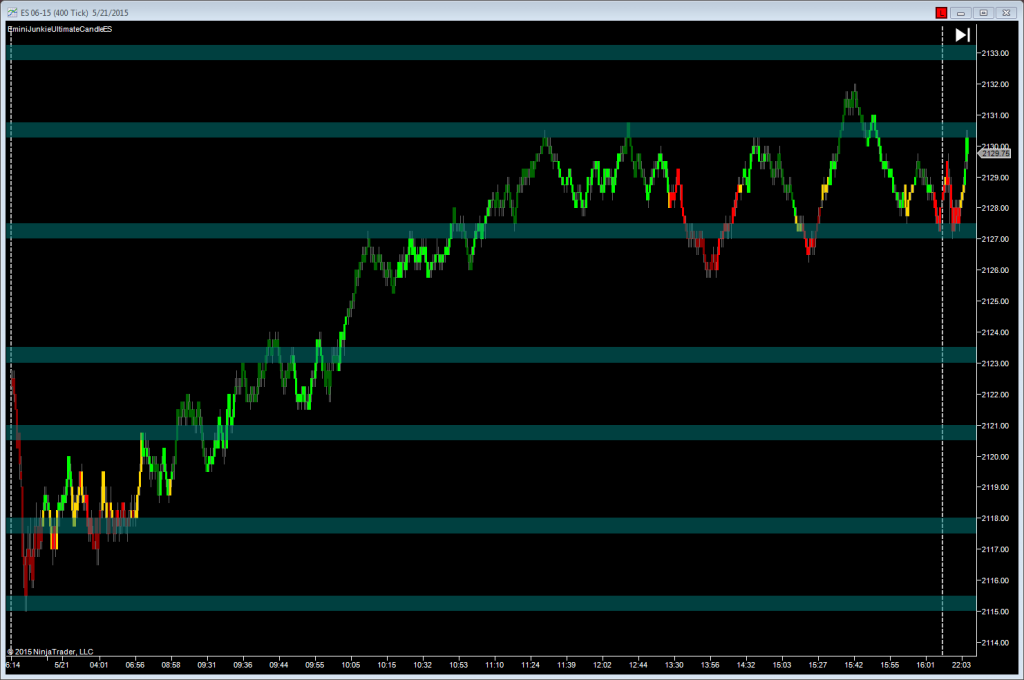
Below are 2 screen shots taken a few days apart… These charts shows intermediate pivots used for intra-day swing trades… Notice the pink band… this is the bull/bear fight line with sell lines (red) above and buy lines (green) below. Look how the market moved into our buy area then took a major bounce. All members of our live trading room get these levels prior to the market open each day as part of our daily trading plan. The following charts were for Tuesday thru Thursday, May 19-21, 2015. Finally the 3rd picture (teal bands) is our daily micro support and resistance levels on a 400 tick chart.


